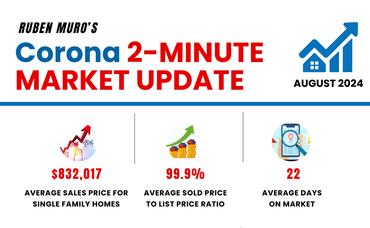
 Here are the Corona California real estate market statistics for November 2024.
The average sales price for homes in Corona was $806,978,
on average homes sold for 98.4%
of their list price. The average days on market were 35
days. There were 362
active listings with 167
new listings and 139
homes sold. The highest priced sale in Corona this year is 4096 LESTER
which sold for $3,500,000.
Inventory is at 2.7
months. There is a -.6% decrease
in average sales price over this same time in 2023.

The average sales price for homes in 92879 was $630,457,
on average homes sold for 95.6%
of their list price. The average days on market were 27
days. There were 42
active listings with 24
new listings and 14
homes sold. The highest priced sale in the 92879 Zip Code this year is 788 BRIANNA WAY
which sold for $1,160,000.
Inventory is at 1.8
months. There is a -7.9% decrease
in average sales price over this same time in 2023.

The average sales price for homes in 92880 was $938,086,
on average homes sold for 99.4%
of their list price. The average days on market were 25
days. There were 61
active listings with 25
new listings and 29
homes sold. The highest priced sale in the 92880 Zip Code this year is 8224 FIELDSTREAM CT.
which sold for $1,300,000.
Inventory is at 2.3
month. There is a +4.3% increase
in average sales price over this same time in 2023.

The average sales price for homes in 92881 was $998,686,
on average homes sold for 98%
of their list price. The average days on market were 29
days. There were 55
active listings with 19
new listings and 21
homes sold. The highest priced sale in the 92881 Zip Code this year is 4096 LESTER.
which sold for $3,500,000.
Inventory is at 3
months. There is a -2.3 % decrease
in average sales price over this same time in 2023.

The average sales price for homes in 92882 was $830,104,
on average homes sold for 99.5%
of their list price. The average days on market were 31
days. There were 81
active listings with 46
new listings and 46
homes sold. The highest priced sale in the 92882 Zip Code this year is 3938 IBBETSON ST.
which sold for $2,100,000.
Inventory is at 2.2
months. There is a +0% increase
in average sales price over this same time in 2023.

The average sales price for homes in 92883 was $765,452,
on average homes sold for 98.3%
of their list price. The average days on market were 46
days. There were 195
active listings with 79
new listings and 55
homes sold. The highest priced sale in the 92883 Zip Code this year is 21856 THIMBLEBERRY CT.
which sold for $1,690,000.
Inventory is at 3.7
months. There is a -4.4 % decrease
in average sales price over this same time in 2023.
Corona is Experiencing its’s slow season right now along with the rest of the market while everyone gets ready for holiday festivities. While the reduction in action can scare some, it is a natural part of our Real Estate business cycle, and despite the slow down in activity there were still 140 closed sales in our last recorded period. for All your winter Real Estate Questions reach out to us for the strategies and practices that have been proven to work!
For Fall Buying Help Look Here
for Fall Selling Help Look Here


